Am I Overpaying? Compare Quebec Grocery Prices in 5 Seconds
Last week you paid $5.99 for a watermelon. Three streets over, the same seedless, regular-format watermelon was $1.69.
That's not a typo, and it isn't even the worst case in our database. For a dozen large grade-A eggs, the lowest price tracked across Quebec in the past 13 weeks was $2.88. The highest? $9.99. Same product, same month, same province.
If you've ever had the nagging feeling you're getting fleeced at the grocery store, you are. Nobody was showing you the numbers next to the bill. Here's what's going on, and the free tool that fixes it.
Seven products you've probably bought this season
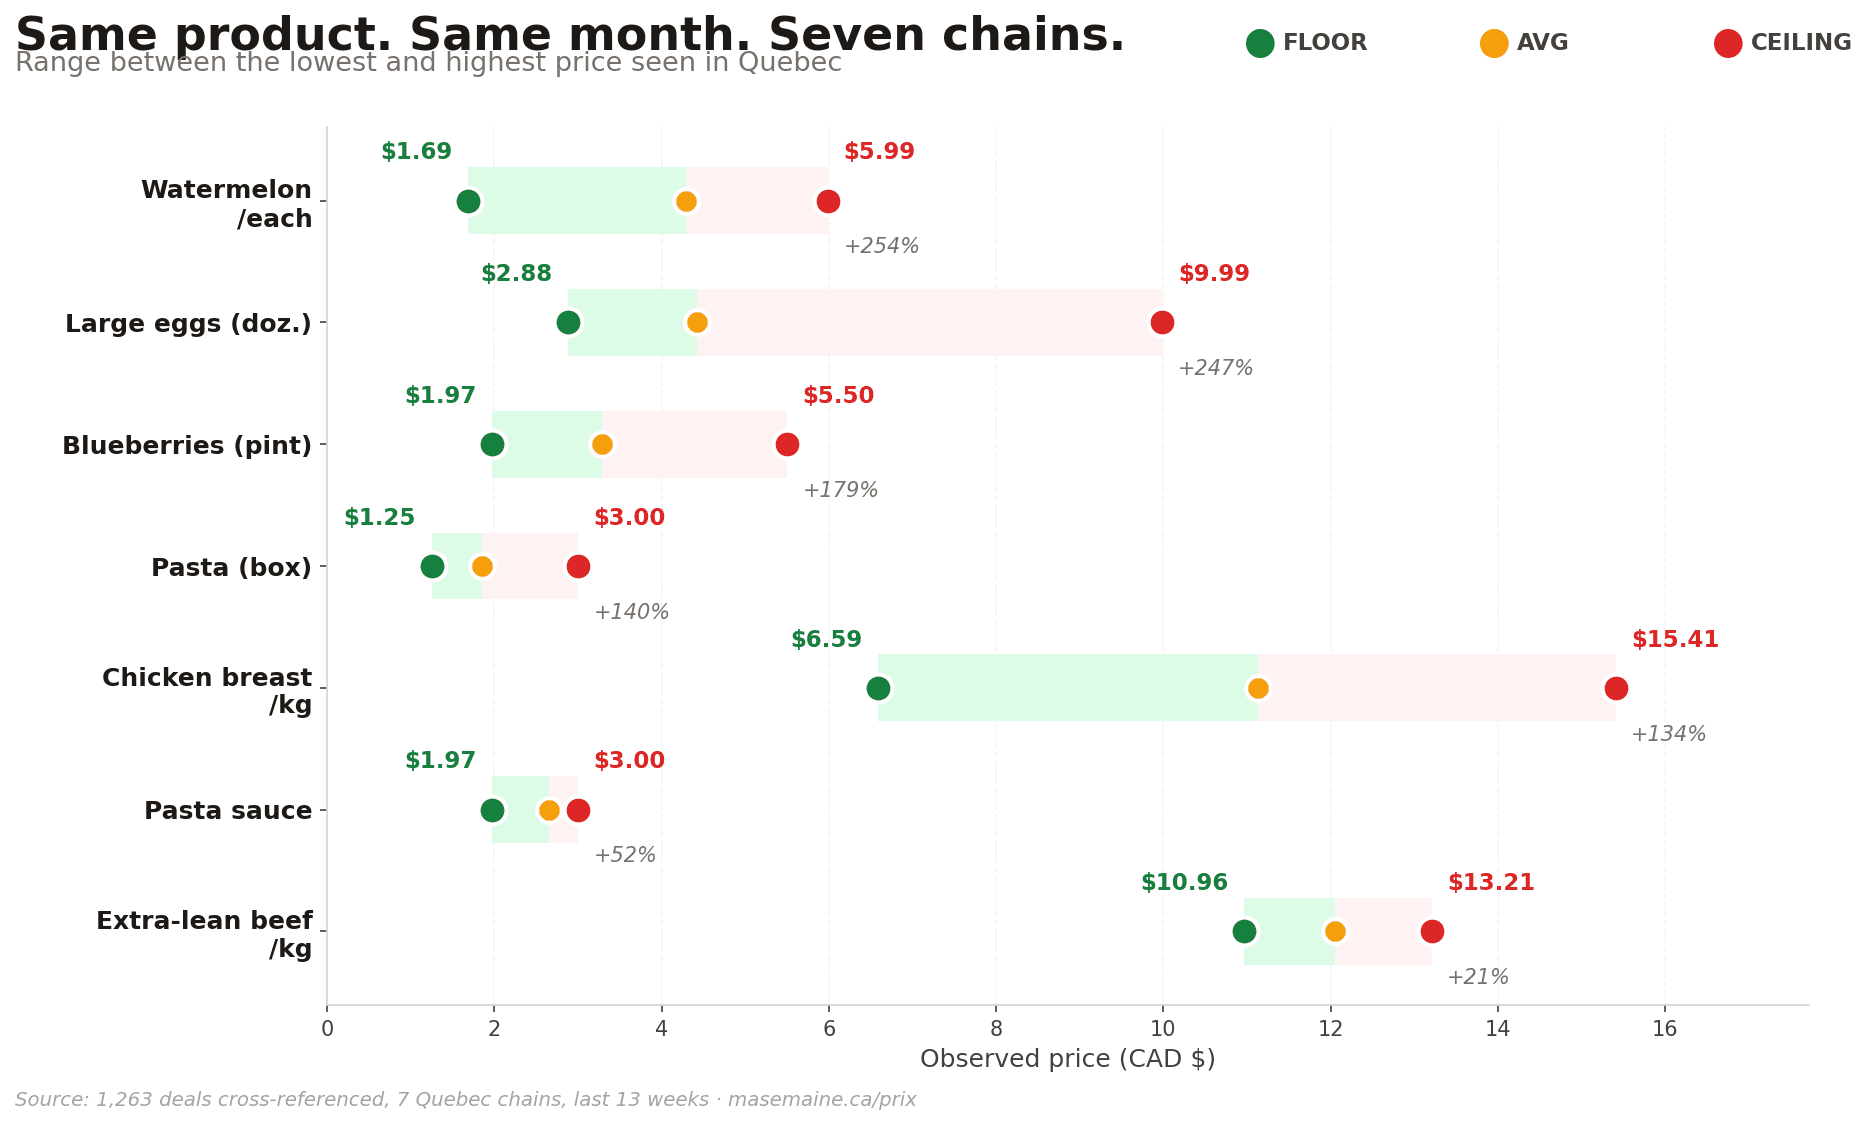
We tracked 1,263 deals across 7 Quebec chains (Maxi, Metro, IGA, Provigo, Super C, Tigre Géant, Walmart) over the past 13 weeks. Here's the gap between the lowest and highest observed price for seven items you probably grab every week.
These numbers are worth a second read.
- Seedless watermelon: $1.69 to $5.99 (spread: 254%).
- Large eggs, dozen: $2.88 to $9.99 (spread: 247%).
- Blueberries (pint): $1.97 to $5.50 (spread: 179%).
- Pasta (regular box): $1.25 to $3.00 (spread: 140%).
- Boneless chicken breast: $6.59/kg to $15.41/kg (spread: 134%).
Pasta and eggs aren't exotic items. Half of Quebec has them in the cart at least every other week.
Why such a gap on an identical product?
Three reasons, all visible in the data.
First, the loss leader. Discount chains (Maxi, Super C, Walmart) drop one product per week well below its replacement cost to pull you through the door. When Maxi puts chicken at $6.59/kg, that's not generosity, it's marketing mechanics.
Second, the banner premium. For the same item, Metro and IGA keep regular prices 15 to 25% higher than Super C or Maxi. That's their model (full service, butcher counter, more imported products). Shop a "full" banner blindly and you pay that premium on every visit.
Third, timing. Our $5.99 watermelon was pre-season. Three weeks later it was $1.69 at another chain. Without price history in front of you, you can't know whether to wait.
The full table
The "floor" is the lowest price observed in the past 13 weeks. The "ceiling" is the highest. The "average" is the arithmetic mean of all tracked deals.
What if you always grabbed the floor?
Buy 1 unit of each of these seven products every week. Pay the average and your basket runs $39.68/week, or $2,063.36/year. Always grab the lowest current price (whatever chain offers it) and your basket runs $27.31/week, or $1,420.12/year.
Gap: $643.24 a year, on seven items. A typical Quebec grocery basket contains 30 to 40. Dalhousie's report projects the average Canadian family will spend $17,571.79 on food in 2026, up to $994.63 more than 2025 1. A meaningful chunk of that increase is avoidable.
Same chicken breast, six chains, six prices
Between the cheapest chain and the most expensive, the gap is $2.70/kg on the same product, same window. Buy 3 kg of chicken a month and that's $97/year of difference on one item alone, before any weekly deal kicks in.
The tool: /prix, no signup
That's exactly what the new masemaine.ca/prix page solves. Here's what it looks like for a search on dozen large eggs:
You type a product ("chicken", "eggs", "blueberries") and instantly see:
- The floor, average, and ceiling price over the past 13 weeks.
- The number of chains it's been seen at (out of 7).
- A historical chart to spot the trend.
- A built-in unit converter ($/lb, $/kg, $/100g), including a "total + weight" mode for Costco-style bulk purchases with rebates.
Search is accent-tolerant and bilingual: "boeuf" finds "bœuf", "egg" finds "œufs", "potato" finds "pomme de terre". The dictionary covers 267 canonical products mapped onto 1,263 deals.
How to use this each week, without changing your routine
The point isn't to track the price of butter. The point is to check the 5 or 6 most expensive items on your list before leaving the house. On those items, the spread justifies the 30 seconds.
Step 1: your week gets planned automatically
You pick what you like, the number of people, the number of meals. The app generates your meal plan.
Step 2: deals from 7 chains are matched to your recipes
The app reads flyers every Thursday. When your recipe calls for chicken breast and it's $6.59/kg somewhere this week, you see it immediately.
Step 3: every item gets a chart icon, tap for price history
In the logged-in version, every line on your grocery list now has a chart icon. One tap shows the same graph you see on /prix, but with chain names visible.
Frequently asked questions
Is it really free? No signup?
Yes. The /prix page is public. No email, no credit card. You type, you see. The only difference with the in-app paid version is that chain names are replaced by letters ("Chain A, B...") on the public page. That's a requirement of the agreements we have with our data sources.
How many chains and how many products are covered?
Seven Quebec chains: Maxi, Metro, IGA, Provigo, Super C, Tigre Géant, Walmart. The dictionary covers 267 canonical products (a canonical product is the generic form of an item, so "boneless chicken breast" rolls up Olymel, Maple Leaf, and store brands). 1,263 deals are currently indexed over about 13 weeks.
Where do the prices come from?
The weekly flyers published by the chains themselves. Our extractor reads them every Thursday, normalizes the format (one product, one unit, one validity window), and groups the variants by canonical product. Every entry has a validity date, a unit, and a price.
Why are store names hidden on the public page?
The chains ask us, reasonably, not to display their prices in a comparative format on a publicly indexed page. So on the public page you see the spreads (floor, average, ceiling), the number of chains seen, and the historical chart, without saying which chain is which. In the in-app version, you see the names.
What's the point if I can't see the store name?
Two very concrete things: knowing whether the price being asked today is inside the normal range or aberrant, and deciding whether to wait. If eggs were $2.88 four weeks ago and are $4.49 today, you know it's worth waiting for the next flyer.
Does the unit converter actually matter?
More than you'd think. Chicken is advertised at $5.49/lb in one flyer, $12.10/kg in another, and per 100g at the butcher. Without conversion, you can't compare. The "total + weight" mode is useful for Costco-style bulk buys: enter the total paid and the package weight, and you get the cost per kilo or per pound.
Does this replace Flipp?
No, it's complementary. Flipp shows you this week's flyers. /prix shows you the history. Is $4.99 this week a deal or a rip-off? Flipp can't tell you. The detailed comparison between Flipp and other Quebec flyer apps explains the differences.
References
- Statistics Canada. Consumer Price Index, April 2026. Food purchased from stores: +3.8% year-over-year. https://www150.statcan.gc.ca/n1/daily-quotidien/260519/dq260519a-eng.htm
- Statistics Canada. Consumer Price Index, February 2026. Fresh or frozen beef: +13.9% year-over-year. Grocery prices have risen 30.1% since February 2021. https://www150.statcan.gc.ca/n1/daily-quotidien/260316/dq260316a-eng.htm
- MaSemaine. Internal data: 1,263 deals, 267 canonical products, 7 Quebec chains, rolling 13-week window. https://masemaine.ca/en/prix
Read more:
- Maxi vs Super C vs Walmart: which is actually the cheapest grocery store in Quebec?
- How to find the best grocery deals in Quebec every week
- 10 foods with the biggest price increases in Canada in 2026
- How much Canadians spend on groceries
- I Analyzed 5 Years of My Own Grocery Receipts — Here's What Happened
Footnotes
-
Canada's Food Price Report 2026 (16th edition), Dalhousie University et al. December 2025. https://www.dal.ca/news/2025/12/04/canada-food-price-report-2026.html ↩