Maigrir coûte plus cher à l'épicerie que courir 15 h par semaine
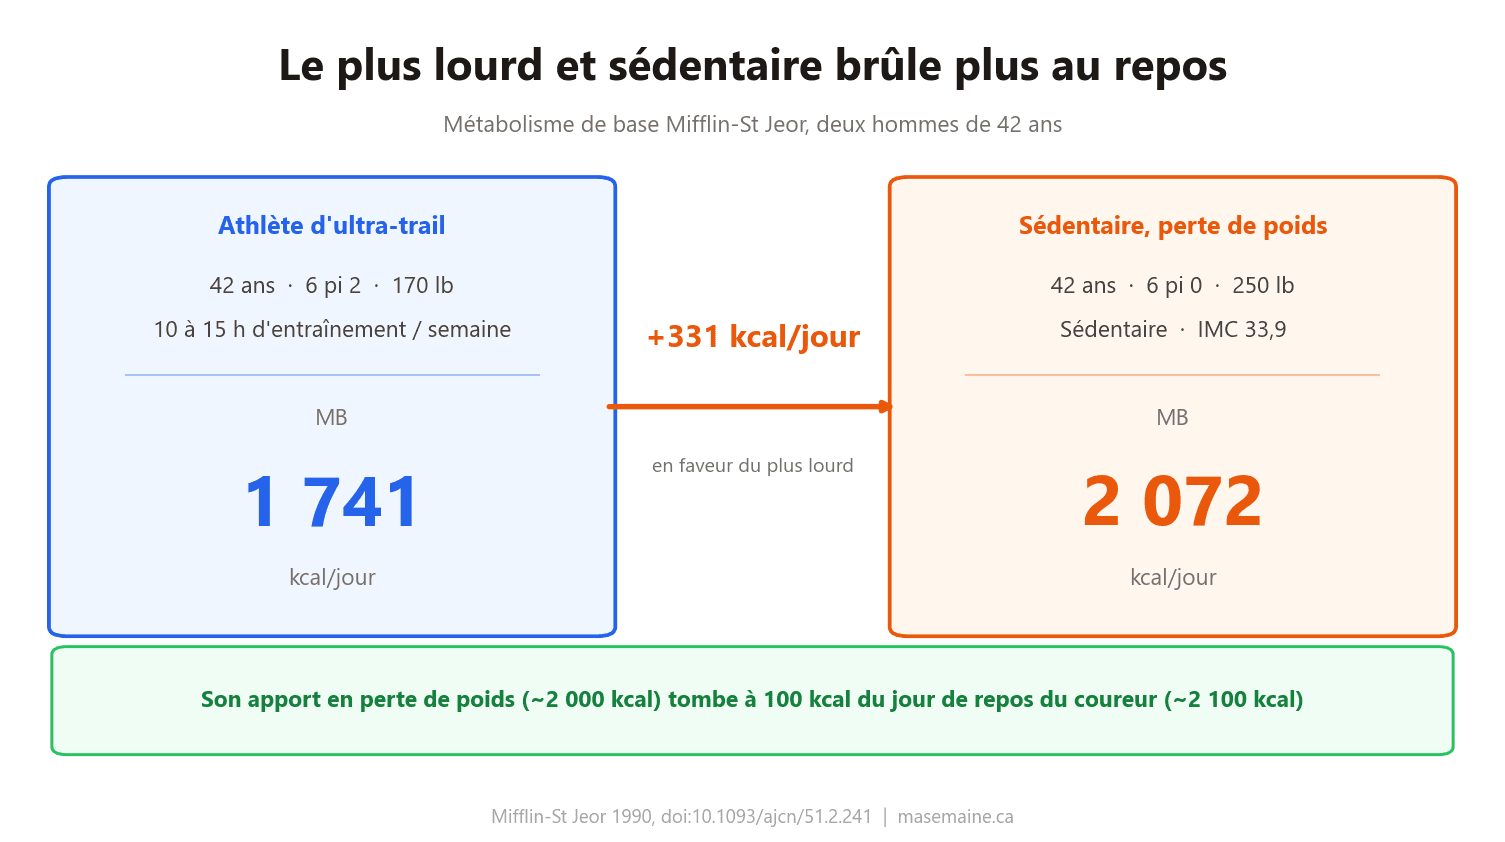
J'ai 42 ans, 6 pi 2, 170 lb, et sur une semaine de pointe je cours entre 10 et 15 heures. Je suis aussi le fondateur d'une application de planification de repas, ce qui veut dire que j'ai un intérêt commercial à vous dire quelque chose de simple et de rassurant. Cet article n'est pas ça. C'est le texte le plus technique de ce blogue, et je l'ai écrit parce que je n'en trouvais nulle part une version honnête.
La comparaison que je veux faire, c'est avec un homme de mon âge qui est, sur papier, mon contraire : 6 pi 0, 250 lb, sédentaire, qui veut perdre du poids. Deux corps qui ne pourraient pas moins se ressembler. Ils finissent par manger neuf des mêmes douze aliments — et la journée où je mange mille calories de plus que lui me coûte moins cher à la caisse. Je vais faire ces calculs-là aussi.
Voici la partie qui m'a arrêté la première fois que j'ai fait les calculs.
D'abord, l'arithmétique
L'équation de Mifflin-St Jeor est l'estimation clinique standard du métabolisme de base — l'énergie que votre corps brûle en ne faisant strictement rien. Chez l'homme [1] :
MB = 10 × poids(kg) + 6,25 × taille(cm) − 5 × âge(ans) + 5
Moi — sujet A
77,1 kg · 187,96 cm · 42 ans
10(77,1) + 6,25(187,96) − 5(42) + 5
771 + 1 174,75 − 210 + 5
1 741 kcal/jour
Sujet B
113,4 kg · 182,88 cm · 42 ans
10(113,4) + 6,25(182,88) − 5(42) + 5
1 134 + 1 143 − 210 + 5
2 072 kcal/jour
2 072 − 1 741 = 331 kcal/jour, en faveur du plus lourd et du plus sédentaire.
Il n'y a aucun tour de passe-passe là-dedans. La masse corporelle est le terme dominant de l'équation, et le sujet B en porte 36 kg de plus. Un corps plus gros — y compris une masse grasse plus grande, qui est métaboliquement active, juste moins par kilogramme que le muscle — coûte plus cher à garder en vie au repos. Il brûle plus que moi couché sur le divan, et il continuera de brûler plus que moi couché sur le divan.
Ça va plus loin, et c'est ici que les deux hommes se rejoignent vraiment — alors allons-y lentement, en trois temps.
Un : le métabolisme de base, ce n'est pas ce qu'on mange. Le métabolisme de base, c'est ce que le corps brûle en ne faisant strictement rien. Personne ne fait rien. S'habiller, marcher jusqu'à l'auto, digérer le dîner : tout ça coûte de l'énergie par-dessus le chiffre de base. La convention, c'est de multiplier le métabolisme de base par un facteur d'activité — et pour quelqu'un de sédentaire, avec un travail de bureau et aucun entraînement, ce facteur est de 1,2.
Deux : ça donne le maintien. Le maintien, c'est l'apport auquel son poids reste exactement où il est. Mangez ça tous les jours et rien ne bouge.
Trois : pour perdre du poids, il faut manger sous le maintien. La prescription standard, c'est 500 kcal par jour sous le maintien.
Sujet B — du métabolisme de base à ce qu'il mange vraiment
Métabolisme de base 2 072 kcal
× 1,2, sédentaire → maintien 2 486 kcal
− 500 kcal de déficit 1 986 kcal
Pourquoi 500 ? Une livre de gras corporel stocke environ 3 500 kcal, et 500 × 7 jours = 3 500 — soit environ une livre par semaine. C'est une règle du pouce, pas une loi : le rythme ralentit à mesure qu'on s'allège, parce qu'un corps plus petit brûle moins.
Donc le sujet B mange ~2 000 kcal/jour pour perdre environ une livre par semaine — tous les jours, à peu de chose près. Son apport ne bouge presque pas.
Le mien bouge énormément. J'ai trois types de journée : ~2 100 kcal un jour de repos, ~3 000 un jour d'entraînement normal, et ~4 600 un jour de longue sortie. Sur la semaine modélisée, ça donne une moyenne de ~3 330 kcal/jour. Rien ici ne dit que je mange 2 100 calories par jour : je mange ça les jours où je ne cours pas.
La comparaison qui vaut la peine, c'est sa journée ordinaire contre mon jour de repos. Là, deux hommes qui n'ont rien en commun visuellement mangent à moins de 100 calories l'un de l'autre.
Une note que je fais une seule fois et que je ne répéterai pas : un IMC de 33,9 est une catégorie clinique, et quiconque s'y trouve devrait avoir cette conversation avec un médecin ou une nutritionniste plutôt qu'avec un blogue. Tout ce qui suit est de l'arithmétique et du mécanisme, pas un avis médical.
Lisez ce tableau avant que je l'explique
Regardez la ligne des protéines, puis celle des glucides.
Macro Moi Lui
Protéines 123-154 g 118-190 g
Glucides 463-771 g 150-230 g
Protéines : essentiellement le même apport en grammes. Glucides : trois à cinq fois d'écart.
La thèse
Deux hommes, les mêmes aliments, des protéines quasi identiques, et un seul véritable axe de différence : la quantité de glucides, et l'endroit où ces glucides se situent par rapport à l'effort physique.
Pourquoi ses protéines se calculent sur la masse maigre et non sur le poids total
La version paresseuse de ce calcul multiplie le poids corporel par un coefficient de protéines. Pour le sujet B, ça donne 113,4 kg × 2,0 = 227 g/jour. Vous verrez ce chiffre imprimé constamment. Il est faux, et il est faux d'une manière précise.
Les besoins en protéines suivent le tissu métaboliquement actif, pas la masse totale. Le tissu adipeux n'a pas de besoin de renouvellement protéique significatif. Calibrer les protéines sur le poids total en contexte d'obésité surestime systématiquement, et c'est exactement pour cette raison que Helms et ses collègues expriment leurs fourchettes par kilogramme de masse maigre plutôt que de poids corporel [9].
À un IMC de 33,9, le pourcentage de gras se situe plausiblement entre 30 et 35 %. Ça donne :
30 % de gras 113,4 × 0,70 = 79,4 kg de masse maigre
35 % de gras 113,4 × 0,65 = 73,7 kg de masse maigre
Masse maigre ≈ 74-79 kg.
La convergence
À 1,6-2,4 g/kg de masse maigre, ça fait 118-190 g/jour — ce qui tombe presque exactement sur mes propres 123-154 g, calculés à la manière classique de l'athlète sur le poids total [8]. Deux hommes séparés par 80 lb, dont un qui court 15 heures par semaine, qui arrivent au même apport absolu en protéines.
Le chiffre de 227 g n'est pas seulement trop élevé : il est dérivé d'un compartiment corporel qui ne le consomme pas. Bien faire ce calcul, c'est la différence entre un plan que quelqu'un peut manger et un plan qu'il abandonne à la deuxième semaine parce que c'est 40 % de protéines par poids.
Les quatre mécanismes sur lesquels tout le reste repose
Ces quatre idées font tout le travail dans cet article. Si vous sautez cette section, la grille de repas plus bas se lira comme une préférence arbitraire.
1. Ce sont les glucides qui laissent le tryptophane entrer dans votre cerveau
Si on vous a déjà dit de ne pas manger de glucides le soir, c'est cette section-ci qui explique pourquoi ce conseil est à l'envers. Tout passe par un seul acide aminé.
Le tryptophane est le précurseur de la sérotonine, qui est le précurseur de la mélatonine. Le tryptophane est aussi l'acide aminé le moins abondant des protéines alimentaires, et il doit franchir la barrière hématoencéphalique par le transporteur de type L — qu'il partage avec les autres gros acides aminés neutres (LNAA), dont les acides aminés à chaîne ramifiée : leucine, isoleucine et valine.
C'est une compétition, et le tryptophane est le plus petit soumissionnaire. Mangez des protéines seules et vous augmentez le tryptophane et ses concurrents : le ratio bouge à peine — en fait, les repas protéinés font baisser le ratio plasmatique de tryptophane, parce que les protéines apportent proportionnellement moins de tryptophane que d'autres LNAA [2].
Les glucides brisent l'égalité. Les glucides font monter l'insuline ; l'insuline pousse les acides aminés à chaîne ramifiée dans le muscle squelettique ; les concurrents quittent la circulation pendant que le tryptophane y reste en bonne partie. Le ratio tryptophane:LNAA monte, et davantage de tryptophane traverse vers le cerveau. C'est le mécanisme décrit par Fernstrom et Wurtman en 1972 [3] et quantifié avec des repas mixtes normaux par le groupe de Wurtman en 2003 [2].
- Repas contenant des glucides
- L'insuline monte
- Les AACR et autres LNAA sont captés par le muscle squelettique
- Le ratio plasmatique tryptophane : LNAA monteLe tryptophane est l'acide aminé le moins abondant. Seul, il perd la compétition pour le transporteur.
- Plus de tryptophane traverse la barrière hématoencéphalique par le transporteur de type L
- Synthèse de sérotonine
- Mélatonine, le soir
Deux conséquences.
Premièrement, « pas de glucides le soir » est mécaniquement à l'envers. La soirée est le seul moment de la journée où le déplacement du ratio de tryptophane, médié par l'insuline, fait quelque chose que vous voulez réellement. La preuve clinique est plus mince que le mécanisme, mais elle pointe dans la même direction : dans un essai randomisé de six mois auprès de 78 personnes vivant avec l'obésité, concentrer les glucides au souper a produit plus de perte de poids et de meilleurs scores de satiété que de les étaler sur la journée [14]. C'est une seule étude, n = 78, dans une population précise. Prenez-la comme une raison d'arrêter de répéter le dogme, pas comme une prescription.
Deuxièmement — et c'est ici que je dois être discipliné — je ne vais pas vous dire que ça va vous faire mieux dormir. Le mécanisme de transport est bien établi. Le passage de « plus de tryptophane atteint le cerveau après un repas glucidique en soirée » à « vous dormez mieux de façon mesurable » ne l'est pas. La meilleure preuve méta-analytique porte sur le tryptophane en supplément, à des doses de 1 g ou plus, où l'effet sur le temps d'éveil après l'endormissement est statistiquement réel mais modeste [4]. Personne n'a montré qu'un bol de sarrasin le reproduit. Énoncer la voie, la citer, s'arrêter là. À la seconde où j'affirme le résultat, ça cesse d'être un article technique.
Alors ça donne quoi, concrètement
Pas un somnifère — je viens de passer un paragraphe à refuser de vous en vendre un. Ça donne la permission, et ça vaut plus que ça en a l'air. « Pas de glucides le soir » enlève le moment le plus pratique de la journée pour placer une bonne partie de ses glucides, celui où les glucides font le plus pour la satiété, et — dans mon cas — celui où ils refont les réserves de glycogène pour la séance du lendemain. La règle retire tout ça et ne donne rien en échange. Le mécanisme, c'est la raison pour laquelle vous pouvez le reprendre sans avoir l'impression de mal faire.
2. Protéine complète, le mythe, et la seule chose qui est vraiment « par repas »
On vous a dit que les protéines végétales sont « incomplètes » et qu'il faut les « combiner » — riz et haricots, au même repas — pour qu'elles soient utilisables. Cette règle vient de Sans viande et sans regrets de Frances Moore Lappé (1971). Lappé elle-même l'a retirée dans des éditions ultérieures. Young et Pellett ont réglé la science en 1994 : le corps maintient un pool d'acides aminés libres, et la qualité protéique s'intègre sur environ une journée, pas sur une seule assiette [5]. Vous n'avez rien à jumeler au même repas pour une simple suffisance protéique.
Alors qu'est-ce qui survit ?
Le score en acides aminés compte toujours. Un aliment peut être limitant dans un acide aminé indispensable, et mélanger des aliments élève le score du mélange. Le profil de référence FAO/OMS/UNU pour l'adulte fixe la lysine à 45 mg par gramme de protéine [16]. Mesurons de vrais aliments contre ce profil :
Les chiffres, calculés à partir de USDA FoodData Central :
- Gruau (avoine) (169705) : 0,701 g de lysine sur 16,89 g de protéines par 100 g = 41,5 mg/g. Sous 45. La lysine est l'acide aminé limitant de l'avoine.
- Farine de blé entier : 0,36 g de lysine sur 13,2 g de protéines = 27 mg/g. Bien en dessous.
- Lait 2 % (171267) : 0,276 g de lysine sur 3,3 g de protéines = 84 mg/g. Bien au-dessus.
- Sarrasin (170286) : 0,672 g de lysine sur 13,25 g de protéines = 50,7 mg/g. Au-dessus.
- Lentilles crues (172420) : 1,72 g de lysine sur 24,6 g de protéines = 70 mg/g. Très au-dessus.
Donc gruau + lait, ce n'est pas de la sagesse populaire — mais soyons précis sur ce que ça fait réellement. Faisons le calcul : 80 g de gruau apportent 0,561 g de lysine sur 13,5 g de protéines ; 250 mL de lait 2 % ajoutent 0,712 g de lysine sur 8,5 g de protéines. Combiné : 1,27 g de lysine sur 22,0 g de protéines = 58 mg/g, confortablement au-dessus du profil de référence.
Ce calcul est réel. Ce qu'il n'est pas, c'est une obligation par repas. Young et Pellett tiennent toujours : ce qui doit dépasser le profil de référence, c'est votre journée, pas votre bol. Mettez du lait sur le gruau et vous avez réglé la lysine de la journée au déjeuner. Mangez des lentilles au souper à la place et vous l'avez réglée tout aussi bien. La combinaison, c'est une commodité, pas une obligation.
Là où ça cesse d'être théorique, c'est quand toute la journée est dominée par les céréales. Le gruau est à 41,5 mg/g, le blé entier à 27. Une journée bâtie sur des céréales, du pain et des pâtes, sans produits laitiers, ni œufs, ni légumineuses, ni viande nulle part, peut réellement manquer de lysine. C'est le cas que la vieille règle visait maladroitement — elle avait tort sur le moment et tort sur le mécanisme, et elle n'avait pas tort sur le fait que les céréales sont pauvres en lysine.
La même chose vaut pour les pâtes avec des lentilles, qui se retrouvent dans mon assiette plus loin dans cet article : le blé dur à ~27 mg/g plus les lentilles à 70 mg/g, dans les proportions où je les mange, donnent un combiné d'environ 48 mg/g. Les lentilles sauvent les pâtes comme le lait sauve le gruau — et, encore une fois, elles les sauveraient tout aussi bien mangées six heures plus tard.
Et voici la seule chose qui est véritablement « par repas » : le seuil de leucine. La synthèse protéique musculaire n'est pas une fonction lisse de l'apport en protéines. Elle se comporte comme un interrupteur avec une gâchette, et la leucine est la gâchette. Moore et ses collègues ont montré en 2009 que la réponse de synthèse à une dose de protéines après l'exercice plafonne autour de 20 g de protéines de haute qualité lorsqu'on la mesure sur les quelques heures qui suivent [6] ; Areta et ses collègues ont montré en 2013 que la façon dont on répartit les mêmes 80 g sur 12 heures change le résultat, 20 g aux trois heures battant à la fois les doses plus petites et plus fréquentes et les doses plus grosses et plus espacées [7]. Phillips et Van Loon, en 2011, décrivent la leucine comme occupant « une position de premier plan » dans le déclenchement de la réponse [8]. Le chiffre de travail est d'environ 2,5 à 3,0 g de leucine par repas.
Et c'est plus de nourriture que ça en a l'air. Mesuré contre de vrais aliments, aucun item de cette liste ne ressemble à une portion normale :
Regardez la quatrième colonne, parce que c'est celle qui induit en erreur. Le lait a la plus forte densité en leucine de tout le tableau, à 94,8 mg par gramme de protéine — et il en faut quand même 800 mL pour franchir le seuil tout seul. Ce n'est pas la densité qui vous y amène. C'est la quantité totale de protéines du repas. C'est pour ça que le déjeuner fonctionne comme un empilement, pas comme un ingrédient vedette.
Ça ne se moyenne pas sur la journée. C'est le seul endroit où la composition par repas survit à la correction de Young et Pellett.
Maintenant, la clarification que cette section vous doit, parce que ce que je viens de décrire ressemble exactement à une règle qu'on vous a eu raison de dire de ne pas croire. Vous avez entendu que le corps « ne peut utiliser que 30 g de protéines par repas ». C'est faux, et ça l'a toujours été — on confondait deux choses. L'absorption n'est pas la contrainte : l'intestin absorbe pratiquement toutes les protéines que vous mangez, à n'importe quelle dose réaliste. Ce que les travaux plus anciens mesuraient, c'était la réponse de synthèse à une dose unique sur une courte fenêtre, et c'est de là que vient le « plateau » de 20-25 g.
Ce plateau s'est révélé être un artefact de la durée d'observation. En 2023, Trommelen et ses collègues ont donné 100 g de protéines contre 25 g après l'exercice et ont suivi la réponse pendant plus de douze heures avec un traceur isotopique quadruple. La dose de 100 g a produit une réponse anabolique plus grande et plus longue, dose-dépendante sur toute la ligne, sans limite supérieure trouvée [18].
Un plancher, pas un plafond
Le seuil de leucine est un plancher, pas un plafond. Sous environ 2,5 g de leucine, un repas déclenche mal la synthèse. Au-dessus, rien n'est gaspillé. Il vous dit ce qu'un repas exige au minimum — il ne vous dit pas quand arrêter, et ce n'est pas la règle des 30 g déguisée en science.
Et un dernier niveau d'honnêteté, parce que la question de la répartition n'est pas aussi réglée qu'une section sur les mécanismes le laisse croire. Tout ce qui précède décrit ce qui se passe de façon aiguë — la synthèse mesurée sur quelques heures. Savoir si ça se traduit par plus de muscle sur des mois est une autre question, et là la réponse penche bien davantage vers le total quotidien.
Schoenfeld et ses collègues ont méta-analysé 23 études en 2013 : l'effet apparent du moment de la prise disparaît dès qu'on contrôle l'apport quotidien total [19]. Le débat entre experts reste ouvert : en 2024, Trommelen, Holwerda et van Loon soutenaient que plusieurs repas modérés battent probablement encore un profil très déséquilibré, tout en admettant que l'effet est petit à côté du simple fait d'atteindre son total quotidien [20].
La vraie hiérarchie
Le total quotidien de protéines fait l'essentiel du travail — les fourchettes de 1,6 à 2,4 g/kg que cet article utilise déjà. La répartition est un effet de second ordre, et elle compte probablement le plus quand le total quotidien est juste. Voyez donc le seuil de leucine comme une bonne façon de concevoir un repas, pas comme une règle qu'on échoue en la ratant. Atteignez votre total de la journée et vous ne perdez pas de muscle parce qu'un déjeuner est tombé à 2,1 g de leucine au lieu de 2,6.
Regardez ce que ce graphique dit vraiment, parce que c'est le point structurel de tout l'article : ce n'est pas la portion de glucides qui franchit le seuil. C'est le lait et les œufs. Ce qui veut dire que le seuil est atteint de façon identique chez les deux hommes — le sujet B mange 60 g de gruau au lieu de mes 100 g et le franchit quand même, parce qu'il garde les deux œufs et le lait.
Le même fait porte un poids différent de chaque côté. Chez moi, la composition par repas compte parce que j'essaie de déclencher la synthèse protéique musculaire de façon répétée autour de l'entraînement. Dans la sienne, le total quotidien de protéines et la satiété dominent, et la leucine par repas est un bonus.
3. Le sarrasin n'est pas un blé, et ça compte ici
Le sarrasin (Fagopyrum esculentum) est un pseudo-céréale — un membre des Polygonacées, apparenté à la rhubarbe et à l'oseille. Ce n'est pas une graminée, pas une céréale, et taxonomiquement nulle part près du blé malgré son nom anglais.
La conséquence pratique, c'est le profil en acides aminés. Le sarrasin franchit le profil de référence adulte FAO/OMS/UNU pour la lysine à 50,7 mg/g — et il franchit aussi le profil soufré, à 30,3 mg/g de méthionine plus cystéine contre une référence de 22 [USDA 170286].
Ce deuxième chiffre est facile à survoler et c'est pourtant celui qui justifie la place du sarrasin. La lysine est ce qui manque aux céréales, donc c'est la lysine que cet article mesure sans arrêt — mais les légumineuses ont le problème inverse, et ce sont les acides aminés soufrés qui leur font défaut. Les lentilles, qui battent le sarrasin sur la lysine et coûtent quatre fois moins cher, arrivent à 21,6 mg/g et ratent ce profil-là. Le sarrasin est la seule base de cet article qui satisfait les deux toute seule, et c'est ce que les gens veulent dire quand ils parlent de protéine complète. Il fait tout seul ce pour quoi le gruau a besoin de lait.
Il apporte aussi 231 mg de magnésium par 100 g — environ 55 % de la référence quotidienne de 420 mg pour un homme adulte, dans une seule portion de 100 g sec.
Réserve honnête, et elle compte sur un blogue qui parle de prix d'épicerie : le sarrasin est l'aliment cher de tout cet article. Le sarrasin en vrac ou en format food-service au Québec tourne autour de 8 à 12 $/kg ; les grains bio de marque sont autour de 22 $/kg. Le gruau est à 3,49 $/kg. Les lentilles sont à 2,80 $/kg — et les lentilles ont un meilleur score de lysine que le sarrasin. Si le budget est la contrainte qui mord, les lentilles vous donnent le même argument d'acides aminés au quart du prix, et je le redis dans la FAQ.
4. Sous-manger et trop manger, c'est la même erreur
C'est la section où la thèse du « pas si différents » est vraiment vraie, et c'est aussi celle où je dois être honnête sur moi-même.
Le côté demande, c'est de l'arithmétique, et elle est déjà faite : un jour de repos me coûte environ 2 100 kcal, un jour d'entraînement normal environ 3 000, un jour de longue sortie environ 4 600.
Le côté apport, c'est du comportement, et le mien ne suit pas l'arithmétique.
Jour de repos besoin 2 100 je mange ~2 100 manque 0
Jour d'entraînement besoin 3 000 je mange ~2 600 manque ~400
Jour de longue sortie besoin 4 600 je mange ~2 700 manque ~1 900
Sur la semaine modélisée, ça fait environ 5 400 kcal de moins — à peu près 770 kcal par jour — et près de 70 % du manque tombe sur les deux jours de longue sortie.
Un jour d'entraînement, j'ai faim et je mange peut-être 500 kcal de plus qu'un jour de repos. Ça me laisse quand même quelques centaines de calories en deçà, ce qui est banal et facile à corriger.
Le jour de longue sortie, c'est le vrai problème, et pas pour la raison qu'on imagine. Ce n'est pas une question de discipline. Après trois ou quatre heures sur le sentier, mon estomac n'est plus intéressé, et la fenêtre où je pourrais raisonnablement rattraper deux mille calories est exactement celle où manger est le moins tentant. Le jour où j'ai besoin du plus de nourriture est le jour où mon corps en veut le moins. C'est ce seul fait qui explique l'essentiel de mon manque hebdomadaire.
La sous-alimentation chronique par rapport à la charge d'entraînement porte un nom dans la littérature en nutrition sportive — le déficit énergétique relatif dans le sport (RED-S) — et le consensus du CIO de 2023 le traite comme un spectre avec des indicateurs cliniques, pas comme un chiffre qu'on réussit ou qu'on rate [11]. Je ne me diagnostique pas dans un billet de blogue. Je pointe une direction, et la direction n'est pas ambiguë.
L'erreur du sujet B va dans l'autre sens. La sienne, c'est de manger plus que sa demande. La mienne, c'est de manger moins que la mienne. Ce sont les mêmes erreurs — un apport mal ajusté à la demande — pointées dans des directions opposées. C'est à ce niveau-là que le « on n'est pas si différents » est vraiment vrai, et je préfère le dire précisément plutôt que de le laisser glisser vers quelque chose de chaleureux et de vide.
La nuance que je ne vais pas esquiver : la sensibilité à l'insuline
Deux des mécanismes ci-dessus supposent une réponse à l'insuline qui fonctionne. À un IMC de 33,9, cette hypothèse est fragile — et elle ne joue pas de la même façon pour les deux, alors ils méritent des verdicts séparés.
Le mécanisme des glucides du soir s'affaiblit effectivement chez lui. C'est aussi celui qui compte le moins. Des acides aminés à chaîne ramifiée élevés à jeûn sont l'une des signatures métaboliques les plus répliquées de l'obésité et de la résistance à l'insuline ; Newgard et ses collègues l'ont caractérisée en 2009 [12]. Ce sont précisément les acides aminés qui font compétition au tryptophane pour le transporteur : il part donc avec plus de monde dans le chemin — et l'étape qui les retirerait est exactement celle que la résistance à l'insuline brise. Plus de compétition au départ, moins du nettoyage qui l'aurait corrigée.
Mais rappelez-vous ce que j'ai promis pour ce mécanisme au départ : rien. C'était une raison d'arrêter d'éviter les glucides le soir, pas une raison de les rechercher. Cette raison-là tient toujours pour lui — les glucides de son souper sont là pour la satiété et pour un repas qu'il va continuer à manger. La moitié « tryptophane » de l'argument ne devrait tout simplement peser d'aucun poids dans son plan, et elle n'en pesait pas beaucoup dans le mien.
L'outil du glucide rapide avant l'effort, lui, ne se transpose vraiment pas. La contraction musculaire fait migrer les transporteurs GLUT4 vers la membrane cellulaire et tire le glucose hors du sang par une voie qui ne passe pratiquement pas par l'insuline [13]. C'est la vraie raison pour laquelle le pain blanc quarante minutes avant une course fonctionne chez moi : j'ai une deuxième porte pour le glucose, et c'est la course qui l'ouvre.
Le sujet B n'a aucune des deux portes qui fonctionne bien. Il ne s'apprête pas à s'entraîner, donc la voie de la contraction reste fermée, et la voie de l'insuline est justement celle qui est en cause. Une charge de glucides rapides fait donc ce qu'elle fait chez quiconque est résistant à l'insuline et assis — une hausse de la glycémie plus forte et plus longue — sans aucun travail de carburant pour la justifier. Et ce n'est pas donné : 300 à 400 kcal, c'est 15 à 20 % de sa journée entière de 2 000 kcal, alors que dans mes 3 000 à 4 600 c'est presque une erreur d'arrondi.
Cette asymétrie, ce n'est pas le même outil qui fonctionne un peu moins bien chez lui. C'est ce qui fait fonctionner l'outil — l'exercice — qui est absent.
Et une troisième asymétrie, celle-là à l'encontre du plan que je lui propose. Toute la journée du sujet B repose sur la satiété — protéines, fibres, volume — pour que 2 000 kcal donnent l'impression d'être assez. Ça suppose que le signal de satiété se rende. La leptine est l'hormone par laquelle le tissu adipeux dit au cerveau qu'il y a assez de réserves, et elle atteint le cerveau par un transporteur saturable à travers la barrière hématoencéphalique : structurellement le même genre de goulot que celui du tryptophane. En contexte d'obésité, la leptine sanguine est élevée et le cerveau se comporte comme si elle était basse.
Pourquoi ça se produit fait l'objet d'un vrai désaccord, et je ne vais pas faire semblant du contraire. Banks et ses collègues ont montré en 2004 que des triglycérides élevés nuisent au transport de la leptine à travers la barrière [21]. Harrison et ses collègues ont tracé ce transport directement chez des souris obèses en 2018 et l'ont trouvé intact, situant plutôt le défaut en aval, dans la signalisation du récepteur [22]. Le phénomène n'est pas en doute ; c'est l'endroit du défaut qui l'est.
Dans un cas comme dans l'autre, la conséquence pratique est la même, et elle a sa place dans un article honnête : les mêmes 2 000 kcal lui donnent probablement plus faim qu'elles n'en donneraient à un homme mince mangeant exactement la même chose. C'est un vent de face physiologique, pas un défaut de caractère — et un plan qui l'ignore ment sur sa propre difficulté.
C'est ce qui empêche les deux plans d'être « le même conseil avec des portions plus petites ».
Les neuf glucides, et pourquoi chaque « défaut » est justement le point
Voici le principe organisateur. Chaque aliment ci-dessous a une propriété que l'écriture nutritionnelle conventionnelle traite comme un défaut. Dans chaque cas, ce défaut est précisément la raison pour laquelle c'est le bon aliment à un moment précis.
Le pain blanc — l'absence de fibres est le point. Le pain blanc porte 2,7 g de fibres par 100 g contre 6,0 g pour le blé entier [USDA 174924, 172688]. Le pire glucide du dogme. Trente à soixante minutes avant un effort, c'est exactement ce que je veux : moins de résidu à trimballer pendant 90 minutes d'impact, et une charge en gras et en fibres plus faible, ce qui vide l'estomac plus vite. Deux tranches de blanc au lieu de deux tranches de blé entier, c'est une différence d'environ 2 g de fibres — peu de chose sur papier, et je ne vais pas la gonfler — mais ce sont 2 g que je trimballerais autrement, plus la différence de vidange gastrique. Le bon glucide pour cette seule fenêtre.
Les pâtes — le fait que vous pouvez en manger 800 kcal sans vous en rendre compte est le point. Les pâtes sèches, c'est 371 kcal par 100 g [USDA 169736]. Deux cents grammes secs, ce qui est une assiette banale, c'est 742 kcal avant l'huile ou le fromage. Dans un déficit à 2 000 kcal, c'est un handicap, et c'est pourquoi les pâtes sont absentes de la journée du sujet B. La veille d'une longue sortie, c'est exactement la propriété qu'on veut : forte charge en glycogène, peu d'effort, faible coût (1,99 $ pour 900 g).
Le gruau — la fibre soluble est la retenue. 10,6 g de fibres par 100 g, dont une part significative en bêta-glucane, et un indice glycémique de 55 contre 75 pour le pain blanc [15]. Libération lente, tient pendant des heures. Limitant en lysine, ce que le lait corrige. C'est le seul repas véritablement identique en structure des deux côtés du tableau.
Le sarrasin — profil d'acides aminés quasi complet plus magnésium. L'aliment de reconstruction du soir. Aussi le seul article où je dois être honnête : le prix ne se justifie pas sur la nutrition seule.
Le pain de blé entier — la base quotidienne par défaut. Plus de fibres que le blanc, plus de protéines, essentiellement le même indice glycémique (74 contre 75). C'est la bonne réponse plate pour tous les moments qui ne sont pas juste avant l'effort.
Le quinoa — la doublure du sarrasin, au prix du sarrasin. Il franchit le profil de lysine à 54 mg/g [USDA 168874], un peu devant le sarrasin, et porte un peu plus de protéines. Il porte aussi le moins de glucides par dollar de tout ce tableau, ce qui, quand on cherche à atteindre 500 g par jour, est un vrai coût. À utiliser au souper quand on veut le profil d'acides aminés et qu'il n'y a plus de sarrasin dans l'armoire. Il n'existe aucune version de cet article où le quinoa bat les lentilles sur le rapport qualité-prix.
Le riz blanc — la céréale la plus vide ici, et c'est justement son rôle. Le moins de fibres (1,3 g), le moins de protéines des céréales (7,1 g), une lysine à 36 mg/g donc bien sous le profil de référence [USDA 169756]. Jugé comme aliment, il perd contre tout ce qui est au-dessus. Mais c'est le glucide le plus dense de la liste à 80 g par 100 g, il est bon marché, et c'est le plus facile à digérer en quantité. C'est exactement ce que demande la deuxième clause de mon propre prompt : quand c'est la fibre qui limite avant le total de calories, le riz est la façon de continuer à manger.
Le cola — du sucre et rien d'autre, et c'est tout le propos. Quarante-deux kilocalories et 10,4 g de glucides par 100 mL, zéro fibre, zéro protéine, zéro de tout [USDA 174852]. Dans toutes les autres lignes de ce tableau, l'argument nutritionnel compte. Ici, il n'y a aucun argument nutritionnel — et à la quatrième heure d'une course, c'est précisément la qualité recherchée. C'est liquide, c'est froid, c'est caféiné, et ça n'exige rien d'un estomac qui a cessé de coopérer. La section plus haut a montré que mon manque des jours de longue sortie est un problème de tolérance digestive, pas de discipline. Voici l'aliment qui existe exactement pour cette défaillance-là, et c'est le cas le plus net de tout l'article d'un aliment qui a raison pendant une heure et tort pendant les vingt-trois autres.
Une limite de portée, énoncée une fois et pensée sérieusement : « il n'y a pas de mauvais glucides, seulement des glucides utilisés au mauvais moment » est une affirmation sur le timing autour de l'effort physique. Rien de plus. Ce n'est pas une défense de la liqueur. Ce n'est pas une défense des chips. Sans cette portée, cette phrase devient de l'apologie de la malbouffe, et j'ai écrit sur pourquoi la nourriture pauvre en nutriments coûte plus cher au bout du compte précisément parce que je ne crois pas à la version sans portée.
La même journée, côte à côte
À gauche, moi un jour d'entraînement normal. À droite, le sujet B dans un déficit de 500 kcal. Même jour de la semaine, même cuisine.
Retraçons chaque choix jusqu'à un mécanisme.
Le déjeuner — identique en structure, différent en volume. Gruau, lait, œufs, des deux côtés. Mes 100 g de gruau contre ses 60 g. Le lait est là dans les deux colonnes parce qu'il comble l'écart de lysine (mécanisme 2). Les œufs sont là dans les deux colonnes parce qu'ils portent la leucine par-dessus le seuil (mécanisme 2 encore) — et le graphique plus haut montre que sa version plus petite le franchit quand même.
Avant l'effort — la seule ligne qui n'existe que de mon côté. Deux tranches de pain blanc et de la confiture, 30 à 60 minutes avant. Peu de fibres, volontairement (le cousin du mécanisme 1 : la vidange gastrique, pas le tryptophane). Sa case dit « rien », et la raison n'est pas la discipline. C'est qu'il n'y a aucun effort à alimenter, et qu'à cause de la nuance sur la sensibilité à l'insuline, une charge de glucides rapides dans sa colonne achète moins et coûte plus.
Le dîner — des pâtes de mon côté, une soupe aux lentilles du sien. Les lentilles apparaissent dans les deux colonnes, à la même quantité de 60 g sec, parce que l'argument de la lysine s'applique identiquement. Ce qui diffère, ce sont les 120 g de pâtes sèches empilées à côté, soit 445 kcal dont j'ai besoin et pour lesquelles il n'a pas de place.
La collation — identique. Yogourt grec, 175 g, des deux côtés. Une banane du mien, une pomme du sien ; la différence, c'est 3 g de glucides et une préférence personnelle, pas un principe.
Le souper — sarrasin et hauts de cuisse de poulet des deux côtés. Mes 100 g de sarrasin contre ses 60 g. Il reçoit 300 g de légumes contre mes 150 g, parce que le volume de légumes, c'est la façon de faire ressembler une journée à 2 000 kcal à un repas. Notez que son souper et le mien coûtent exactement la même chose : 2,68 $.
Avant le coucher — du lait des deux côtés. C'est le moment dont parlait le mécanisme 1, ramené à ce que j'ai réellement promis : les glucides ne sont pas là pour faire mieux dormir qui que ce soit, ils sont là parce qu'il n'y a jamais eu de bonne raison de les éviter. J'ajoute deux tranches de pain de blé entier ; lui non, parce qu'il lui reste 12 g de glucides dans le budget et qu'il m'en reste 37. Même principe, marge différente.
Et du pain plutôt que davantage de sarrasin, parce que les deux ne se disputent pas ce moment-là. Le sarrasin mérite sa place au souper pour la qualité de ses acides aminés et son magnésium, à côté du poulet. Ici, le lait fournit déjà la protéine et le tryptophane : les glucides n'ont qu'à être présents — et le glucide le moins cher de la cuisine fait ça aussi bien que le plus cher. Payer trois fois plus les 100 g de sarrasin à cette heure-là n'achèterait rien.
Un chiffre de cette grille ne concorde pas avec ma propre cible
Ma journée d'entraînement modélisée totalise 443 g de glucides — 5,7 g par kilogramme de poids corporel — ce qui est sous la fourchette de 6 à 10 g/kg que j'ai moi-même imprimée comme cible dans le tableau de profil [10]. Ce n'est pas une erreur d'arrondi et je ne vais pas la laisser passer.
C'est la même sous-alimentation que l'écart d'apport avait déjà signalée, qui revient une deuxième fois par un chemin complètement différent. Un calcul compte les kilocalories contre ce que la journée coûte ; celui-ci compte les grammes de glucides contre une recommandation publiée pour mon volume d'entraînement. Les deux disent que je me situe à la limite basse de ce que la littérature en endurance recommande, et la conclusion sensée, c'est qu'ils ont raison et que c'est moi qui devrais changer.
J'ai laissé le chiffre tel quel plutôt que de gonfler la grille pour atteindre la cible. Et pour être précis sur ce qu'est la grille : c'est la journée construite pour répondre à la demande, pas la transcription de ce que j'ai réussi à manger. Un jour de longue sortie, je suis loin du compte, pour les raisons ci-dessus.
La vérification de cohérence
Si ces deux colonnes énuméraient des aliments entièrement différents, toute la prémisse serait un mensonge. Voici donc l'audit :
Neuf lignes sur douze apparaissent des deux côtés. Deux sont à moi seulement, et les deux sont directement rattachées à l'effort : du pain blanc avant une course, des pâtes à la hauteur d'une journée d'entraînement. La ligne que je préfère, c'est le poulet — le sédentaire en mange deux fois plus que l'ultra-traileur, parce que la protéine est le macronutriment qu'on protège en déficit et que j'ai 443 g de glucides qui font le travail calorique dans ma colonne.
Le résultat sur le coût, qui m'a surpris
Ma journée d'entraînement à 3 000 kcal coûte 8,13 $ aux prix de tablette du Québec. Sa journée en déficit à 2 000 kcal coûte 8,56 $.
La journée en déficit coûte plus cher pour un tiers de calories en moins. Par 1 000 kcal : 2,71 $ pour moi, 4,30 $ pour lui — 59 % de plus par calorie.
La raison est structurelle, pas accidentelle. Mes mille calories supplémentaires viennent presque entièrement des choses les moins chères de l'épicerie : les pâtes à 2,21 $/kg, le gruau à 3,49 $/kg, le pain à 4,44 $/kg. Sa journée est pondérée vers les protéines et le volume de légumes, et c'est là qu'est l'argent. C'est la même arithmétique que dans l'article sur la densité nutritive, vue par l'autre bout : les calories sont bon marché, la satiété ne l'est pas.
Ce qui est une chose franchement utile à savoir avant de bâtir un budget de perte de poids. Couper les calories ne coupe pas votre facture d'épicerie. Si quoi que ce soit, ça la fait monter par calorie, et l'article sur l'économie de la perte de poids est là où j'ai travaillé quoi faire avec ça.
Ce qui change un jour de repos (colonne athlète seulement)
Je n'ajoute délibérément pas un axe repos/entraînement à la colonne de perte de poids. Une grille de deux colonnes par cinq repas par deux types de journée est illisible, et il n'y a rien d'intéressant dedans — sa journée n'a pas de stimulus d'entraînement à déplacer.
La mienne, oui.
Trois choses ne bougent pas : les protéines, les glucides du soir avec le lait, et la structure du déjeuner. Les protéines ne bougent pas parce que le renouvellement protéique musculaire ne prend pas de congé, et si quoi que ce soit, l'argument pour les protéines est plus fort un jour de repos, quand le substrat est réparé plutôt que brûlé. Le repas du soir ne bouge pas parce que le mécanisme 1 n'a rien à voir avec le volume d'entraînement.
Une chose bouge beaucoup : les glucides passent de 443 g à 200 g — de 5,7 g/kg de poids corporel à 2,6 g/kg. Le pain blanc d'avant l'effort disparaît complètement parce qu'il n'y a pas d'avant l'effort.
Ça fait 243 g à retirer, et l'ordre n'a rien d'arbitraire. Chaque aliment s'en va en proportion de ce que la séance justifiait de sa présence.
1 Pain blanc avant l'effort −42 g plus rien à alimenter
2 Pâtes du dîner −90 g aucun glycogène à refaire
3 Les deux bananes −52 g fruits liés à l'effort
4 Gruau du déjeuner, réduit −33 g les œufs et le lait gardent le seuil
5 Portion du souper, réduite −26 g composition inchangée
Total −243 g. Rien sur cette liste ne quitte l'assiette sauf le pain blanc et les pâtes ; le reste, ce sont des réductions. Le lait et le pain avant le coucher ne bougent pas du tout.
Le pain blanc part en premier et ne coûte rien, parce que sa seule qualité était l'absence de fibres avant un effort qui n'aura pas lieu. Les pâtes partent ensuite, et en entier : dans cet article, les pâtes servent à refaire le glycogène, et il n'y a aucune séance pour laquelle le refaire. Les lentilles restent dans le bol — elles n'ont jamais été du carburant, elles étaient de la protéine et de la lysine.
Les bananes partent en troisième, parce qu'elles existent pour encadrer l'entraînement. Puis le gruau diminue de moitié, et c'est là que le graphique de la leucine rapporte une deuxième fois : couper le gruau ne me coûte pas la gâchette, parce que ce sont les œufs et le lait qui la déclenchent. Le même fait qui permet au sujet B de manger 60 g de gruau au lieu de mes 100 g me permet de couper davantage un jour où je ne cours pas.
Le souper diminue en dernier et diminue le moins — une portion plus petite de la même assiette. Le sarrasin ne s'en va pas, parce que son rôle n'a jamais été d'alimenter l'effort : il est là pour les acides aminés et le magnésium, et un jour de repos ne change pas mes besoins en acides aminés. Idem pour le lait avant le coucher, qui ne bouge pas du tout. Le mécanisme 1 se fiche de savoir si je me suis entraîné.
Et voici le chiffre qui boucle tout l'article :
2,6 g de glucides par kilogramme, mon jour de repos, tombe à l'intérieur de la fourchette de 2 à 3 g/kg de masse maigre prescrite pour la perte de poids du sujet B.
Le jour où je ne m'entraîne pas, ma prescription de glucides s'effondre sur la sienne. Pas approximativement — dans la même fourchette. Les deux colonnes ne sont pas deux philosophies. C'est une seule règle, évaluée à deux niveaux de demande différents.
Quand la séance mange la journée
La grille plus haut a six cases bien rangées. Les vraies semaines d'entraînement, non. Il est 11 h et je pars pour trois heures et demie de répétitions en côte : cette seule décision détruit déjeuner-dîner-souper comme structure, et la vraie question n'est pas comment réarranger les cases. C'est où sont censées aller 4 600 kcal quand il y a une montagne au milieu de la journée.
La réponse que j'ai mis le plus de temps à accepter : une séance aussi longue a son propre repas à l'intérieur d'elle-même. La recommandation est de 30 à 60 g de glucides par heure pour des efforts d'une à deux heures et demie, et jusqu'à 90 g par heure au-delà, avec des glucides à transporteurs multiples pour que l'absorption suive [10]. Sur trois heures et demie, ça fait 210 à 315 g de glucides — environ 840 à 1 260 kcal — mangés en mouvement.
C'est le cinquième ou le quart de toute la journée, et ça n'apparaît nulle part dans la grille, parce que la grille modélise une journée d'entraînement normale et pas celle-là.
07 h 30 Déjeuner complet, comme n'importe quel autre jour
10 h 15 Avant l'effort glucide rapide, peu de fibres
11 h 00 Départ 60 à 90 g de glucides par heure
14 h 30 Fin de séance 210 à 315 g mangés en mouvement
15 h 00 Repas d'après remplace le dîner - des protéines, pas que des glucides
19 h 00 Souper a lieu quand même - sinon la journée est perdue
Le souper n'est pas sauté. Le dîner s'est déplacé à 15 h, et un millier de calories ont été mangées sur le sentier.
Les deux choses qui changent vraiment sont donc celles-ci. Le dîner ne disparaît pas, il se déplace — le repas d'après-séance à 15 h, c'est le dîner, et il doit porter des protéines et pas seulement des glucides, parce que le seuil de leucine se fiche de l'heure qu'il est. Et le souper a lieu quand même. Plus petit, plus tard que mon appétit ne le voudrait, et c'est le repas que je suis le plus tenté de sauter parce que j'en ai déjà mangé un gros à trois heures de l'après-midi.
Et oui, c'est le seul moment où une poudre de whey mérite sa place. La whey contient environ 10 à 11 % de leucine par poids de protéine : à peu près 25 g de protéines livrent donc autour de 2,7 g de leucine — dans le seuil, en une seule boisson. Comparez au tableau plus haut dans cet article : 195 g de gruau sec, 233 g d'œuf, ou 800 mL de lait pour atteindre les mêmes 2,5 g.
Mais soyons précis sur ce qui fait le travail, parce que ce n'est pas que la whey soit une protéine supérieure. C'est qu'elle est liquide et concentrée, dans la seule fenêtre de la semaine où la nourriture solide est la moins attirante et où mon estomac vient de passer trois heures et demie à être secoué. C'est exactement le même argument que le cola deux sections plus haut et le riz une section plus haut, et ça vaut la peine de le dire franchement : rendu ici, l'article ne parle plus vraiment de nutrition. Il parle de livrabilité — ce qui va réellement passer, à l'heure où ça doit passer.
Par gramme de protéine, la whey coûte plusieurs fois le prix des lentilles ou des œufs. Vous n'achetez pas une meilleure protéine. Vous achetez le fait que ça passe quand plus rien ne passe, les deux jours par semaine où c'est ça, la contrainte. Les cinq autres jours, c'est une façon coûteuse de boire quelque chose que vous auriez pu mâcher.
Le sauter, c'est exactement comme ça que le manque se creuse. Regardez ce que coûte l'autre version de la journée : alimentez la séance correctement et environ mille calories arrivent pendant que je bouge, ce qui rend les repas restants ordinaires. Sautez cette alimentation, rentrez vide à 14 h 30, mangez une seule assiette énorme, et découvrez à 19 h que la nourriture ne vous dit plus rien — la journée se termine autour de 2 700 kcal contre une demande de 4 600. Ce n'est pas un scénario hypothétique. C'est l'arithmétique du début de cet article, vue de l'intérieur : 1 900 kcal de moins un jour de longue sortie, et 70 % de mon déficit hebdomadaire assis sur deux journées qui ressemblent exactement à celle-là.
C'est aussi ici que l'argument du glucide facile et pas cher cesse d'être théorique. Personne ne mange du sarrasin à la troisième heure. Le cola, une banane, quelque chose de sucré et de liquide — les aliments qui ont le pire dossier nutritionnel de tout cet article sont les seuls qui fonctionnent dans la fenêtre où l'essentiel de l'énergie de la journée doit être livré.
Mangez le bon jusqu'à ce que ça compte, puis mangez le facile
Vous n'avez pas à atteindre votre total de glucides avec l'aliment qui franchit le profil d'acides aminés. Vous avez à franchir le profil avec lui. Une fois que le mélange dépasse 45 mg de lysine par gramme de protéine, chaque gramme de glucides supplémentaire peut venir de ce qu'il y a de moins cher et de plus facile à digérer — parce que l'aliment cher a déjà fait son travail.
La question cesse donc d'être « combien de sarrasin puis-je me forcer à avaler » pour devenir « combien de sarrasin me faut-il vraiment avant d'avoir le droit de passer au riz ».
Voyez ça comme un compte en banque, parce que c'est exactement ce qu'est le calcul.
Un aliment franchit le profil quand il apporte plus de 45 mg de lysine pour chaque gramme de protéine qu'il amène. Tout ce qui dépasse cette ligne est un surplus — de la lysine mise en banque. Le riz est sous la ligne : chaque gramme de riz ajouté dépense donc un peu de ce surplus. Quand le compte tombe à zéro, le mélange est redescendu à 45 mg/g et il faut arrêter.
Il n'y a donc que deux chiffres qui comptent : combien chaque base met en banque, et à quelle vitesse chaque glucide de volume le dépense.
Sarrasin 100 g 672 mg de lysine − 45 × 13,25 g de protéines = 76 mg en banque
Quinoa 100 g 766 mg de lysine − 45 × 14,12 g de protéines = 131 mg en banque
Lentilles 100 g 1720 mg de lysine − 45 × 24,63 g de protéines = 612 mg en banque
Un gramme de riz blanc dépense 0,63 mg. Un gramme de pâtes en dépense 2,34 mg.
C'est tout le concept, et ça répond à la question évidente : le sarrasin pourrait-il porter autant de riz que les lentilles ? Oui — il en faut juste davantage. Les lentilles mettent 612 mg en banque par 100 g contre 76 mg pour le sarrasin, environ huit fois plus : le sarrasin arrive donc au même endroit avec environ huit fois le volume. Pour porter les 973 g de riz que soutiennent 100 g de lentilles, il faudrait à peu près 485 g de sarrasin, ce que personne ne va manger.
Rien ici ne dit que les lentilles sont magiques. Elles sont simplement l'aliment le plus dense en lysine du tableau, alors elles achètent le plus de liberté par gramme — la même raison pour laquelle elles battaient le sarrasin sur le prix plus tôt dans cet article, en arrivant par un autre chemin.
Et regardez où finit la ligne des lentilles. À 973 g de riz, la lysine a complètement cessé d'être la contrainte ; le total calorique de la journée avait pris le relais bien avant.
Une précision, parce que sinon ça se lit comme une optimisation et ça n'en est pas une. Pour l'athlète, le problème devient très vite d'être capable de manger assez, tout simplement. À 500 ou 700 g de glucides par jour, la contrainte cesse d'être le savoir et devient la capacité. Je sais quoi manger. C'est de le faire descendre qui est difficile.
Trois cents grammes de sarrasin, ce n'est pas un repas, c'est une corvée — beaucoup de fibres, lourd, et écœurant au troisième bol. Et se forcer à avaler des aliments difficiles à digérer n'est pas un problème de discipline qu'on règle en se forçant davantage ; c'est un problème de volume avec un plafond physique. La section plus haut a déjà montré où ce plafond me mène : 5 400 kcal de moins sur une semaine, dont 70 % du manque les deux jours où j'ai le plus besoin de manger.
La question utile n'est donc pas « comment manger plus du bon aliment ». C'est « combien peu du bon aliment me faut-il, pour que le reste puisse être facile ». Le riz n'est pas dans cet article parce qu'il est nutritif. Il y est parce qu'il passe encore quand plus rien ne passe.
Maintenant la partie que je n'avais pas vue venir. Le riz porte trois à quatre fois plus de volume que les pâtes, et la raison est à l'inverse de l'intuition : le riz est la céréale la plus vide, et c'est précisément pour ça que ça marche. Les pâtes apportent 13 g de protéines par 100 g contre 7 g pour le riz, et cette protéine est pauvre en lysine (~27 mg/g). Plus de protéines de mauvaise qualité fait chuter le score du mélange plus vite que moins de protéines de mauvaise qualité. C'est la protéine, pas le glucide, qui dilue le score.
Ce qui veut dire que la deuxième clause de mon propre prompt — accompagne-les de glucides plus faciles à digérer — a une réponse précise, et c'est le riz plutôt que les pâtes. Pas parce que le riz est un meilleur aliment. Parce que le riz s'efface.
Alors, est-ce que je devrais juste manger plus de lentilles ?
C'est la conclusion à laquelle cette section invite, et elle est presque juste. Les lentilles mettent en banque huit fois la lysine du sarrasin par gramme, coûtent quatre fois moins cher, et portent le plus de protéines de tout le tableau. Pour le sujet B, elles sont proches du meilleur aliment de tout cet article — pas chères, rassasiantes, riches en protéines, à faible indice glycémique. Je ne trouve pas d'argument contre.
Pour moi, la réponse est plus étroite : les lentilles sont la meilleure base, pas le volume. Elles mettent en banque le surplus qui rend le riz possible. Ce qu'elles ne peuvent pas faire, c'est fournir le volume, parce que 100 g de lentilles sèches apportent aussi 10,7 g de fibres — et la fibre, c'est le plafond que je frappe chaque jour de longue sortie. Les lentilles achètent la permission de manger du riz. Elles ne la remplacent pas.
Et il y a une vraie raison de ne pas pousser les lentilles jusqu'au bout. Toute cette section a noté les aliments sur la lysine, parce que la lysine est l'acide aminé qui manque aux céréales. Renversez le régime pour que les légumineuses dominent et l'acide aminé limitant se renverse avec lui — vers les acides aminés soufrés, la méthionine et la cystéine. Mesurés contre le même profil de référence FAO :
Lentilles lysine 69,8 mg/g (profil 45) mét+cys 21,6 mg/g (profil 22)
Riz blanc lysine 36,2 mg/g mét+cys 44,0 mg/g
Sarrasin lysine 50,7 mg/g mét+cys 30,3 mg/g
Les lentilles passent juste sous le profil soufré. Le riz est au double. Le sarrasin franchit les deux, ce qui justifie l'argument du pseudo-céréale plus haut.
Les lentilles manquent exactement de ce que le riz a en surplus, et le riz manque exactement de ce que les lentilles ont en surplus. La paire à laquelle cette section est arrivée par l'arithmétique de la lysine et la tolérance digestive se révèle donc complémentaire dans les deux sens à la fois — ce qui est probablement pourquoi le riz et les lentilles forment l'une des plus vieilles associations de base sur terre, dans une douzaine de cuisines qui l'ont compris sans tableur.
Le résumé honnête : mangez plus de lentilles que vous n'en mangez probablement. N'essayez pas d'en faire toute l'assiette.
La partie où vous pouvez vraiment vous en servir
Tout ce qui précède est un plan que je peux garder en tête parce que je l'ai bâti. Le mode d'échec de l'écriture nutritionnelle, c'est de s'arrêter ici, à « maintenant allez planifier ça vous-même », ce qui est exactement l'endroit où les lecteurs décrochent.
Le générateur de menu hebdomadaire de MaSemaine a un champ de texte libre à l'étape 2 — « Autres préférences (optionnel) » — et tout ce que vous y écrivez est passé directement dans la requête de planification. Pas un menu déroulant, pas une étiquette. Du vrai texte, réellement utilisé.
Utilisez le générateur de plan hebdomadaire pour ça, pas la boîte de génération d'une recette à la fois — l'assistant hebdomadaire est le chemin qui transporte ces contraintes jusqu'au bout.
Copiez-collez ceci si vous êtes la colonne athlète :
Athlète d'ultra-trail, gros volume d'entraînement. J'ai besoin de beaucoup de glucides, alors privilégie des sources de glucides qui sont aussi des sources de protéines — lentilles, sarrasin, gruau. Mais accompagne-les de glucides plus faciles à digérer, sinon c'est la charge en fibres qui devient la limite avant le total.
Copiez-collez ceci si vous êtes la colonne perte de poids :
J'essaie de perdre du poids. Privilégie des sources de glucides qui sont aussi de bonnes sources de protéines, pour que les calories que je mange apportent des protéines avec elles.
Lisez les deux l'une à côté de l'autre. Elles commencent pareil — que les glucides portent de la protéine — et seul l'athlète ajoute une deuxième clause, parce que lui seul a un total à atteindre que des glucides riches en protéines ne peuvent pas remplir seuls. C'est tout cet article, en deux phrases à coller dans une boîte de texte.
Les deux restent volontairement générales. Vous décrivez une contrainte, vous n'écrivez pas un menu ; transformer ça en menu, c'est le travail du générateur. Ajoutez vos propres chiffres si vous les avez — le calcul de Mifflin-St Jeor en haut de l'article prend trente secondes — mais vous n'en avez pas besoin pour que ça fonctionne.
Puis la semaine sort de l'autre côté
Les trois captures ci-dessous viennent de l'application, mais ce sont des captures génériques réutilisées dans ce blogue — pas le résultat généré à partir du prompt ci-dessus. Elles montrent ce que l'outil fait, pas ce qu'il a produit pour moi. Si quelque chose dedans contredit le plan de cet article, c'est la capture qui est générique, pas le plan qui change.
Avec les rabais de la semaine intégrés
La raison pour laquelle les coûts de cet article sont de 8,13 $ et 8,56 $ plutôt que de 12 $, c'est que la protéine a été achetée au bon prix. Les hauts de cuisse de poulet sont à 7,69 $/kg en régulier et à 3,99 $/kg en solde — cette seule ligne déplace un budget hebdomadaire plus que n'importe quel choix nutritionnel de cet article.
Et une liste que vous pouvez vraiment magasiner
Foire aux questions
Un sédentaire de 250 lb brûle vraiment plus au repos qu'un ultra-traileur ? Est-ce un artefact de formule ? C'est réel pour le métabolisme de base, et ce n'est pas un artefact : la masse corporelle est le terme dominant de Mifflin-St Jeor parce qu'un corps plus gros coûte réellement plus cher à garder en vie au repos. Les réserves honnêtes : les équations prédictives comportent une erreur significative par rapport à la dépense de repos mesurée chez un individu, et elles sont moins précises aux extrêmes de composition corporelle. Et le classement s'inverse dès qu'on ajoute l'activité — son maintien sédentaire est de ~2 490 kcal, mon jour de longue sortie de ~4 600. Le but de la comparaison n'est pas qu'il brûle plus au total. C'est que le terme au repos, celui qu'on suppose explicatif de tout, pointe à l'inverse de l'intuition.
« Pas de glucides après 18 h », est-ce que ce n'est pas encore le bon conseil pour maigrir ? C'est l'énergie totale sur la journée qui détermine le changement de poids ; l'horloge n'est pas une variable métabolique au sens où le folklore le laisse croire. Mécaniquement, la soirée est le meilleur moment pour les glucides, parce que c'est là que la hausse du ratio tryptophane:LNAA médiée par l'insuline fait quelque chose d'utile [2,3]. Le seul essai randomisé directement pertinent a trouvé plus de perte de poids et une meilleure satiété quand les glucides étaient concentrés au souper chez des personnes vivant avec l'obésité [14] — une étude, n = 78, six mois. Prenez-le comme une raison d'abandonner la règle, pas de l'inverser en une nouvelle règle.
Pourquoi calculer ses protéines sur la masse maigre plutôt que sur le poids total ? Parce que le tissu adipeux n'a pas de besoin de renouvellement protéique significatif, alors calibrer les protéines sur la masse totale surestime systématiquement en contexte d'obésité. Poids corporel × 2,0 donne 227 g/jour pour le sujet B ; masse maigre × 1,6-2,4 donne 118-190 g. Le chiffre plus bas n'est pas un compromis, c'est le bon dénominateur. Helms et ses collègues expriment leurs fourchettes par kilogramme de masse maigre exactement pour cette raison [9]. C'est aussi, concrètement, la différence entre un plan que quelqu'un peut manger et un plan qu'il abandonne.
Est-ce que manger des glucides en soirée va me faire mieux dormir ? Je n'affirme pas ça, et je veux être explicite sur le pourquoi. Le mécanisme de transport — glucides, insuline, clairance des AACR, ratio tryptophane:LNAA plus élevé, plus de tryptophane vers le cerveau — est bien établi [2,3]. Le passage de là à un résultat mesurable sur le sommeil à partir d'aliments ordinaires ne l'est pas. La preuve méta-analytique porte sur le tryptophane en supplément à ≥ 1 g/jour et montre une réduction modeste du temps d'éveil après l'endormissement [4]. Un bol de sarrasin n'est pas cette intervention. La voie est réelle ; affirmer le résultat serait un abus.
Le pain blanc est correct, alors ? Non — il est correct dans une fenêtre, ce qui n'est pas la même phrase. Trente à soixante minutes avant un effort, sa propriété la plus mal notée (2,7 g de fibres par 100 g contre 6,0 g pour le blé entier) est justement celle qu'on veut, plus une vidange gastrique plus rapide. À toute autre heure de la journée, le blé entier est le meilleur défaut : plus de fibres, plus de protéines, essentiellement le même indice glycémique. L'affirmation « il n'y a pas de mauvais glucides, seulement des glucides au mauvais moment » est bornée au timing autour de l'effort physique. Sans cette borne, c'est n'importe quoi.
Le sarrasin coûte trois fois le prix du gruau. Est-ce que ça vaut la peine ? Souvent, non. Les vrais avantages du sarrasin sont un score de lysine qui franchit seul le profil de référence de la FAO (50,7 mg/g), 231 mg de magnésium par 100 g, et l'absence de gluten. Mais les lentilles ont un meilleur score de lysine (70 mg/g) à 2,80 $/kg — le quart du prix du sarrasin. Si le coût est votre contrainte qui mord, les lentilles gagnent l'argument des acides aminés sans discussion, et vous achetez le sarrasin pour la texture et le magnésium, ou pas du tout. Je ne vais pas prétendre qu'une pseudo-céréale à 9-22 $/kg est un aliment de base budgétaire quand la légumineuse à 2,80 $/kg la bat sur la mesure que je viens de défendre pendant 400 mots.
Vous dites que vous mangez 5 400 kcal de moins par semaine que nécessaire. Pourquoi le publier ? Parce que c'est ce que l'arithmétique dit, et que le cacher rendrait le reste de l'article moins fiable, pas plus. Un jour de repos me coûte environ 2 100 kcal et je les mange. Un jour d'entraînement coûte environ 3 000 et j'en mange autour de 2 600. Un jour de longue sortie coûte environ 4 600 et je mange à peine plus qu'un jour d'entraînement, parce qu'après trois ou quatre heures mon estomac n'a aucune envie de rattraper deux mille calories. Environ 70 % du manque hebdomadaire tombe sur ces deux journées. La réserve honnête : la dépense à l'effort est une estimation de montre, le chiffre le plus bruyant de toute la comparaison — donc prenez la taille de l'écart comme approximative. La direction, elle, ne l'est pas.
Je ne suis ni ultra-traileur ni obèse. Quelle colonne s'applique à moi ? Les deux, parce que c'est la même règle. Les glucides suivent la demande, et ils se placent près de l'effort. Quelqu'un qui s'entraîne trois heures par semaine à poids stable se situe entre les deux colonnes : plus de glucides que le sujet B, moins que moi, avec le glucide rapide réservé aux séances qui le justifient vraiment. La structure — gruau avec lait et œufs le matin, protéines maintenues constantes, une portion de glucides avec un produit laitier en soirée — est identique dans toutes les colonnes. Seul le volume bouge.
Références
- Mifflin MD, St Jeor ST, Hill LA, Scott BJ, Daugherty SA, Koh YO. A new predictive equation for resting energy expenditure in healthy individuals. Am J Clin Nutr. 1990;51(2):241–247. doi:10.1093/ajcn/51.2.241
- Wurtman RJ, Wurtman JJ, Regan MM, McDermott JM, Tsay RH, Breu JJ. Effects of normal meals rich in carbohydrates or proteins on plasma tryptophan and tyrosine ratios. Am J Clin Nutr. 2003;77(1):128–132. doi:10.1093/ajcn/77.1.128
- Fernstrom JD, Wurtman RJ. Brain serotonin content: physiological regulation by plasma neutral amino acids. Science. 1972;178(4059):414–416. doi:10.1126/science.178.4059.414
- Sutanto CN, Loh WW, Kim JE. The impact of tryptophan supplementation on sleep quality: a systematic review, meta-analysis, and meta-regression. Nutr Rev. 2022;80(2):306–316. doi:10.1093/nutrit/nuab027
- Young VR, Pellett PL. Plant proteins in relation to human protein and amino acid nutrition. Am J Clin Nutr. 1994;59(5 Suppl):1203S–1212S. doi:10.1093/ajcn/59.5.1203S
- Moore DR, Robinson MJ, Fry JL, et al. Ingested protein dose response of muscle and albumin protein synthesis after resistance exercise in young men. Am J Clin Nutr. 2009;89(1):161–168. doi:10.3945/ajcn.2008.26401
- Areta JL, Burke LM, Ross ML, et al. Timing and distribution of protein ingestion during prolonged recovery from resistance exercise alters myofibrillar protein synthesis. J Physiol. 2013;591(9):2319–2331. doi:10.1113/jphysiol.2012.244897
- Phillips SM, Van Loon LJC. Dietary protein for athletes: from requirements to optimum adaptation. J Sports Sci. 2011;29(sup1):S29–S38. doi:10.1080/02640414.2011.619204
- Helms ER, Aragon AA, Fitschen PJ. Evidence-based recommendations for natural bodybuilding contest preparation: nutrition and supplementation. J Int Soc Sports Nutr. 2014;11:20. doi:10.1186/1550-2783-11-20
- Thomas DT, Erdman KA, Burke LM. Position of the Academy of Nutrition and Dietetics, Dietitians of Canada, and the American College of Sports Medicine: Nutrition and Athletic Performance. Med Sci Sports Exerc. 2016;48(3):543–568. doi:10.1249/MSS.0000000000000852
- Mountjoy M, Ackerman KE, Bailey DM, et al. 2023 International Olympic Committee's (IOC) consensus statement on Relative Energy Deficiency in Sport (REDs). Br J Sports Med. 2023;57(17):1073–1097. doi:10.1136/bjsports-2023-106994
- Newgard CB, An J, Bain JR, et al. A branched-chain amino acid-related metabolic signature that differentiates obese and lean humans and contributes to insulin resistance. Cell Metab. 2009;9(4):311–326. doi:10.1016/j.cmet.2009.02.002
- Richter EA, Hargreaves M. Exercise, GLUT4, and skeletal muscle glucose uptake. Physiol Rev. 2013;93(3):993–1017. doi:10.1152/physrev.00038.2012
- Sofer S, Eliraz A, Kaplan S, et al. Greater weight loss and hormonal changes after 6 months diet with carbohydrates eaten mostly at dinner. Obesity. 2011;19(10):2006–2014. doi:10.1038/oby.2011.48
- Atkinson FS, Brand-Miller JC, Foster-Powell K, Buyken AE, Goletzke J. International tables of glycemic index and glycemic load values 2021: a systematic review. Am J Clin Nutr. 2021;114(5):1625–1632. doi:10.1093/ajcn/nqab233
- Consultation d'experts FAO/OMS/UNU. Protein and amino acid requirements in human nutrition. Série de rapports techniques de l'OMS n° 935. Genève : OMS ; 2007.
- U.S. Department of Agriculture, Agricultural Research Service. FoodData Central, SR Legacy. Entrées citées dans le texte : sarrasin 170286, avoine 169705, lait 2 % 171267, lentilles crues 172420, pain blanc 174924, pain de blé entier 172688, pâtes sèches 169736, œuf entier 173424.
- Trommelen J, van Lieshout GAA, Nyakayiru J, et coll. The anabolic response to protein ingestion during recovery from exercise has no upper limit in magnitude and duration in vivo in humans. Cell Rep Med. 2023;4(12):101324. doi:10.1016/j.xcrm.2023.101324
- Schoenfeld BJ, Aragon AA, Krieger JW. The effect of protein timing on muscle strength and hypertrophy: a meta-analysis. J Int Soc Sports Nutr. 2013;10(1):53. doi:10.1186/1550-2783-10-53
- Trommelen J, Holwerda AM, van Loon LJC. Protein intake distribution: beneficial, detrimental, or inconsequential for muscle anabolism? Response to Witard & Mettler. Int J Sport Nutr Exerc Metab. 2024;34(5):325–328. doi:10.1123/ijsnem.2024-0107
- Banks WA, Coon AB, Robinson SM, et al. Triglycerides induce leptin resistance at the blood-brain barrier. Diabetes. 2004;53(5):1253–1260. doi:10.2337/diabetes.53.5.1253
- Harrison L, Schriever SC, Feuchtinger A, et al. Fluorescent blood-brain barrier tracing shows intact leptin transport in obese mice. Int J Obes. 2019;43(6):1305–1318. doi:10.1038/s41366-018-0221-z
Données de prix : prix réguliers de tablette chez Maxi, Super C et Walmart dans le grand Montréal, début 2026, tels que compilés pour l'article de comparaison des épiceries. Les prix en solde sont indiqués séparément lorsqu'ils sont utilisés.
Lire aussi :